
Revitalizing Best Mart: End-to-End Data Engineering & Business Intelligence Strategy ?
A full-stack analytics project combining Azure SQL database design, Power Automate workflows, and Tableau storytelling to diagnose performance declines and optimize supply chain allocation.
📊 Executive Summary
Role: Analytics Consultant
Tools: Azure SQL, Microsoft Power Automate, Tableau, Excel, Microsoft Forms
Outcome: designed a scalable data infrastructure and developed a strategic roadmap to address a 7.79% Year-over-Year (YoY) sales decline and optimize inventory across 7 regions.
In this project, I acted as a consultant for Best Mart, a multi-regional retail chain. The company faced a systemic decline in performance in early 2021, specifically a 21% revenue collapse in the Sylhet region. My objective was two-fold:
- Build the data management system: Design a relational database to centralize sales and return data (SQL schema, ERD, automation workflows).
- Strategic performance analysis: Create an interactive Tableau dashboard to diagnose root causes and recommend business strategy recommendations for sales and marketing and supply chain teams.
🛠️ Part 1: Data Architecture & Engineering
To move Best Mart from reactive problem-solving to proactive optimization, I designed a centralized data system using Azure SQL Database.
The Relational Schema
I moved the company’s flat files to a structured Star Schema to support efficient querying and historical analysis. The model integrates five core entities: Customer, Transaction, Product, Store, Payment and Time.
- Fact Table:
Transaction(Sales revenue, quantities, payment methods) - Dimension Tables:
Store(Regional data),Product(Categories, Suppliers),Customer(Demographics),Payment(Payment method, preffered bank)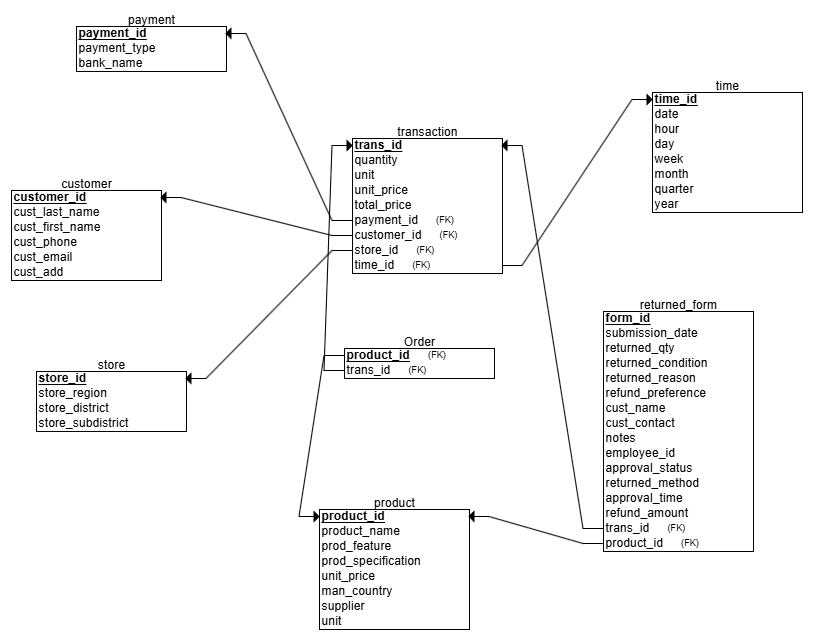
Entity Relationship Diagram (ERD):

Automated Returns Workflow
One of the key operational bottlenecks was tracking product returns. I implemented an automated pipeline to sync return data directly into the SQL warehouse:
- Input: Customers submit data via Microsoft Forms and Employees review the recorded data via Microsoft Excel Online
- Processing: Microsoft Power Automate flows trigger upon submission.
- Storage: Data is automatically cleaned and inserted into the
Returned_Formtable in Azure SQL. - Action: This real-time feed alerts the supply team to quality control spikes (e.g., damaged “Coffee K-Cups”).
📈 Part 2: Analytical Business Insights
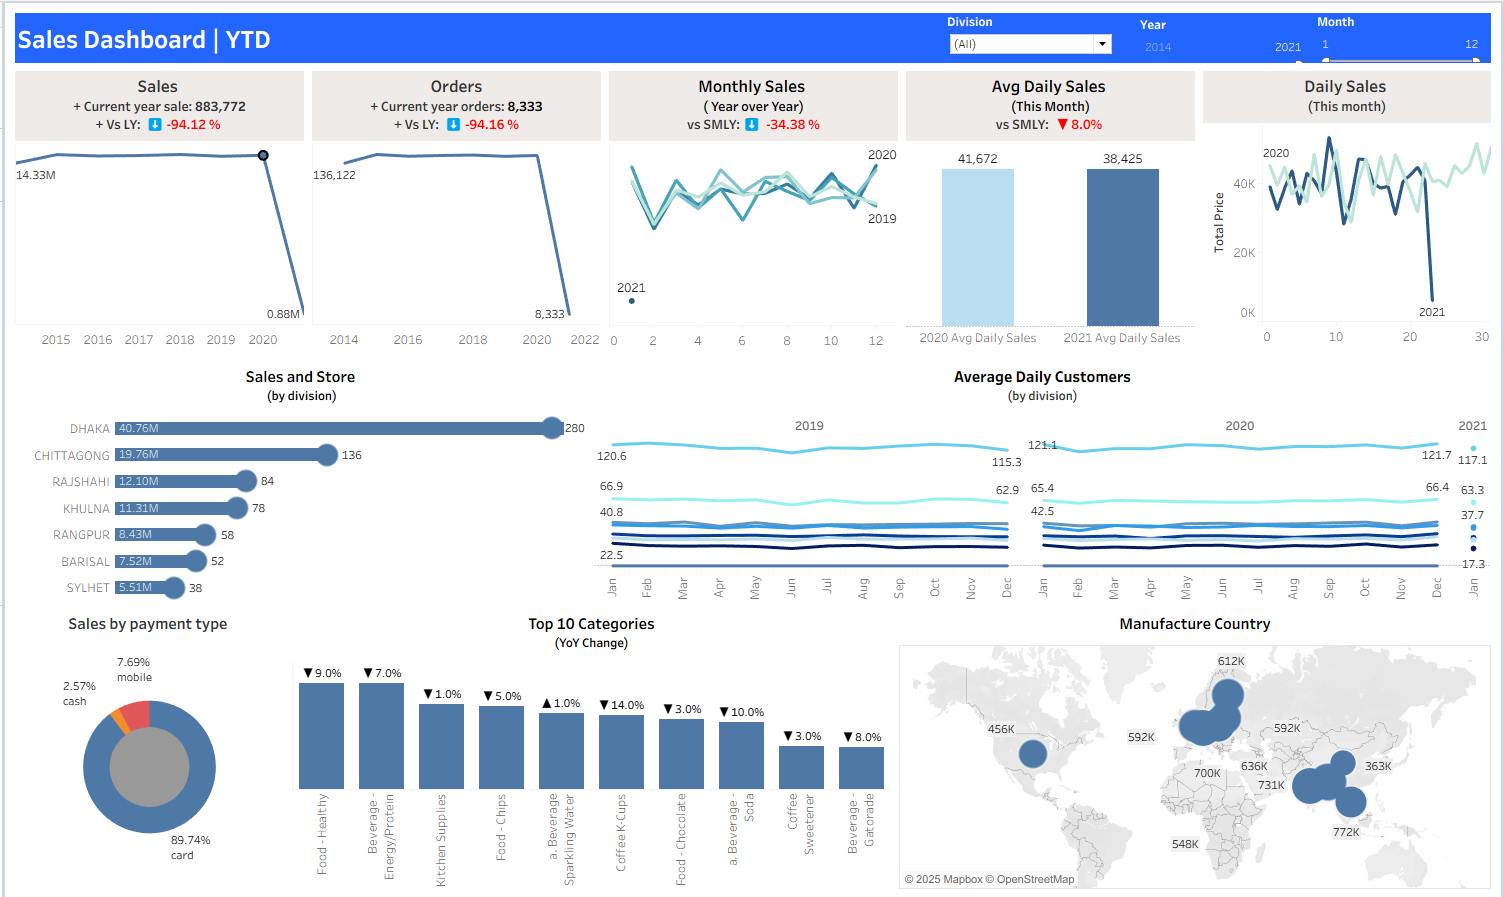
With the database live, I connected Tableau to the Azure SQL server to analyze the January 2021 performance crisis.
The Dashboard (Diagnostic)
KPIs tracked:
- YTD Sales
- Average Daily Orders
- Daily Active Users
- Payment Method Distribution
- Top Product Categories
👉 View the Interactive Dashboard on Tableau Public
The Storyboard: Tableau (Explanatory)
Narratives built for stakeholder
- Scenario 1 – Sales & Marketing
The diagnostic revealed several critical findings:
- The Traffic Crisis: While sales dropped 7.79%, the daily order count dropped even sharper by 9.2%. This indicated that the problem was lost customer traffic, not reduced spending power.
- Regional Disparity: While the core market (Dhaka) softened by 8%, the Sylhet region crashed by 21%.
- Strategy: market audit, retention campaigns, traffic-driver promotions, weekly KPI monitoring.
- Scenario 2 – Supply Planning
Deep-diving into Sylhet’s inventory, I uncovered a massive structural shift in consumer behavior, termed the “Coffee Ecosystem Collapse”:
- Dead Stock: In 2020, “Coffee Stirrers” were the #1 item. In 2021, they dropped to last place, with related items like K-Cups and Creamers falling by ~68%.
- Surge Demand: Conversely, durable goods like “Dishware - Bowls” saw a 113% surge in demand.
- Strategy: imports, expedite home goods, inter-store transfers, weekly volatility reviews.
💡 Part 3: Strategic Recommendations
Based on the data, I proposed a two-pronged recovery strategy:
1. Marketing & Operations (Q2)
- Market investigation: Rapid diagnostic audit in Sylhet
- Shift KPIs: Move from “Volume Discounts” (e.g., Buy 2 Get 1) to “Traffic Drivers” (e.g., Free Coffee with Visit) to address the 9.2% drop in footfall.
- Retention Campaign: Launch a “Dhaka Returns” campaign targeting the top 10% of lapsed customers with personalized re-engagement offers.
2.Chain & Inventory (Immediate)
- Stop Imports: Freeze Q2 orders for Coffee Pods/Creamers in Sylhet to prevent dead stock accumulation.
- Inter-Store Transfer: Transfer existing coffee inventory from Sylhet to Dhaka, where the category is still growing (+9%), effectively liquidating risk.
- Expedite Logistics: Air-freight “Home Goods” to Sylhet to meet the unexpected 113% demand surge before stockouts occur.
⚙️ Limitations & Next Steps
- Data scope: January 2021 only; risk of seasonal bias and lack of other datas: inventory, cost..
- External factors missing: competitor activity, infrastructure, political events.
- Next steps: expand dataset, integrate external variables, refine forecasting models.
Project Artifacts
- Interactive Dashboard: Click here to view
- Story - Performance Review: Click here to view
- Story - Supply Chain Deep Dive: Click here to view
- Presentation: Click here to view