
Delivery Performance Deep Dive: What’s Driving Customer Dissatisfaction?
This project analyzes delivery order data from Cincinnati over a 30-day period, spanning September 16 to October 14, 2022. The dataset contains 60,583 entries across 19 columns, covering order details, delivery timestamps, driver assignments, and grocery partner performance.
🚨 Executive Summary
Our service is facing two critical challenges:
- Late Deliveries (4.7%) — driven by extreme delays in driver acceptance, especially for low-priced orders
- Order Accuracy (2.5%) — compromised by grocery store partners, leading to unresolved complaints
Recommended Actions:
- Restructure Driver Incentives — make low-priced orders more attractive
- Partner Success Program — deploy DashMart’s best practices across grocery partners
- Peak Hour Optimization — boost driver supply from 19:00 to 00:00
👉To reproduce this on the dataset or a similar dataset, you can follow the Jupyter Notebook
📊 Data Quality
- Data Quality: High, with minor completeness issues
- Low percentage of missing data:
DELIV_DASHER_ID,DELIV_D2R,DELIV_CLAT. These gaps are unlikely to affect most analyses. Therefore, I’ve chosen to drop null rows, as these fields are essential for downstream processing - Intentional Blanks:
DELIV_CANCELLED_AT,SUBSTITUTE_ITEM_NAME,CATEGORY
🔥 Market snapshot
- Total Orders: 60,583 (Sep 16–Oct 14, 2022, Cincinnati)
- Cancellation Rate: 1.1%
- Late Delivery Rate: 4.7%
- Missing/Incorrect Rate: 2.5%
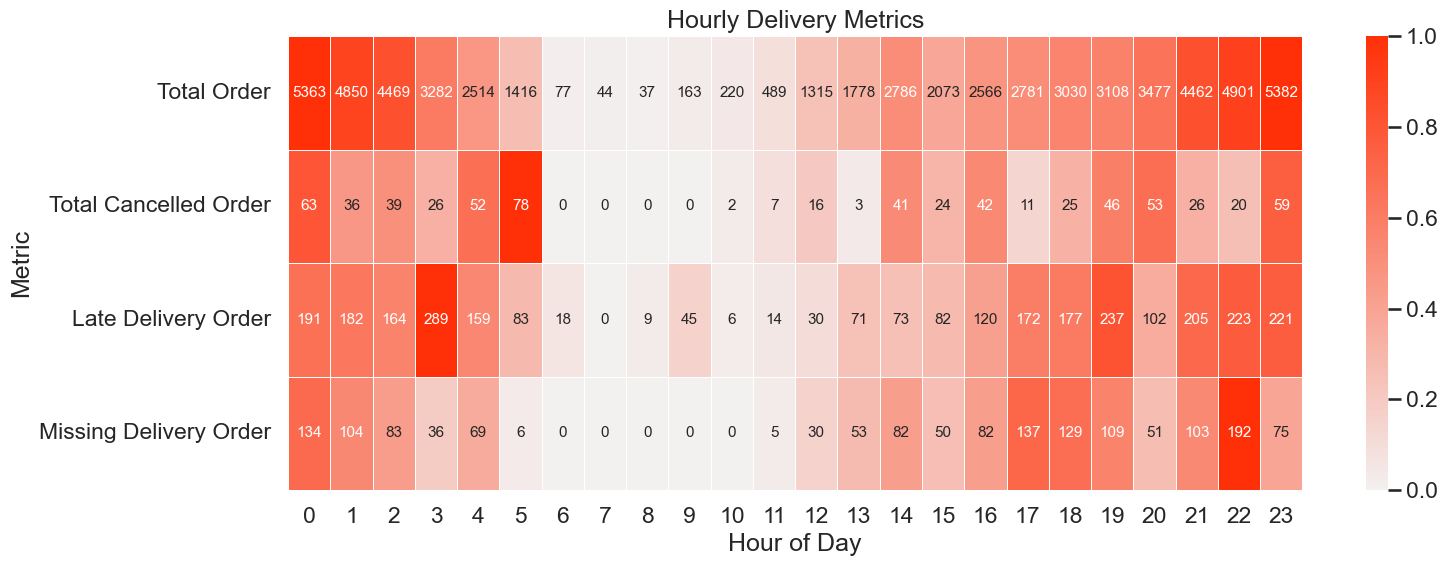
🔥 Market Patterns & Hourly Trends
- Order Peaks: 23:00–03:00 and 18:00–22:59
- Stable Hours: 06:00–11:00
- Critical Window: 19:00–00:00 — highest concentration of late and missing deliveries
- Cancellations: Low and consistent
🧍 Customer Experience
Order Accuracy:
- Resolution Gap: Only 8% of complaints were resolved with substitutions
- Mismatch Rate: 166 substitute items didn’t match original category

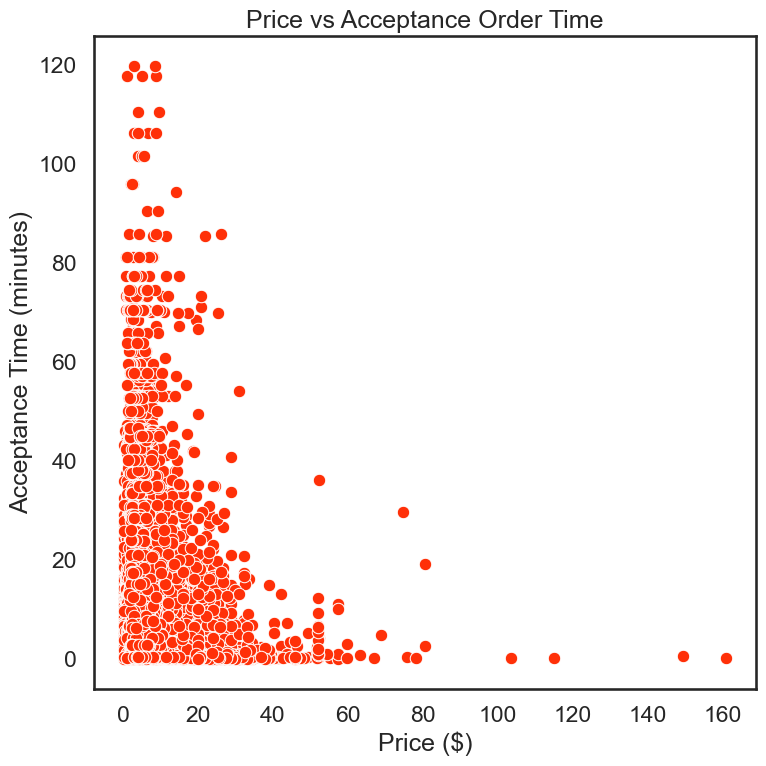
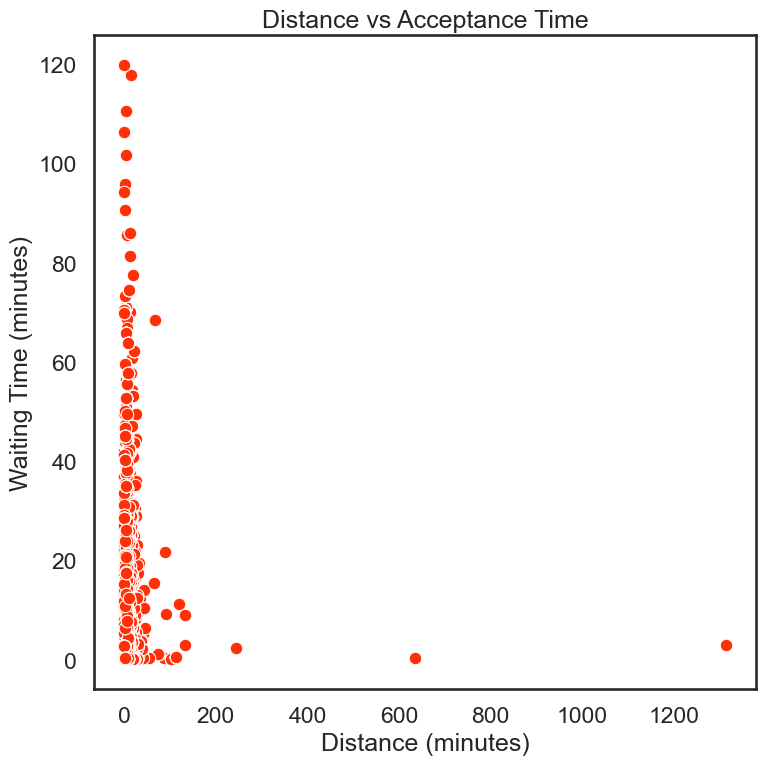
Wait Time:
- Median Acceptance Time: ~1.5 minutes
- Outliers: Up to 120 minutes
- Insights: Low-priced orders (< $0.20) ignored by drivers

🚗 Dasher Performance
-
Travel Time Impact: Longer store arrival → higher chance of late delivery
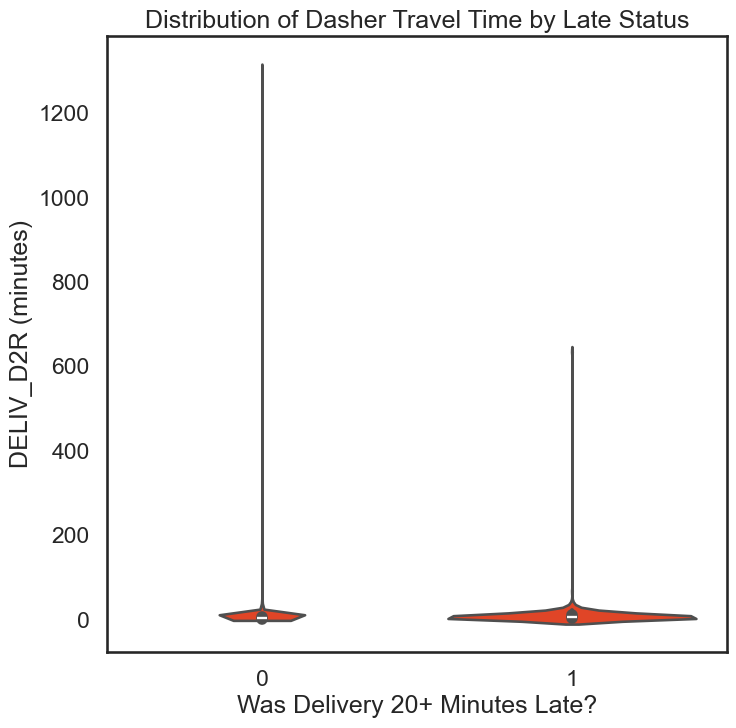
-
Price Sensitivity:
- Orders < $0.20 → longest wait times
- Orders > $0.40 → fast, predictable acceptance
🛒 Merchant Reliability
DashMart vs Grocery Stores:
- DashMart:
- Missing Rate: 0.2%
- Substitution Rate: 0.1%
- Grocery1:
- Missing Rate: 14.8%
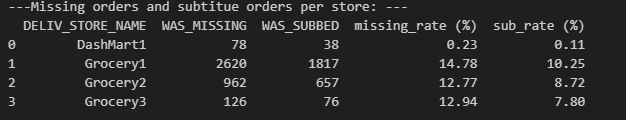
- Missing Rate: 14.8%
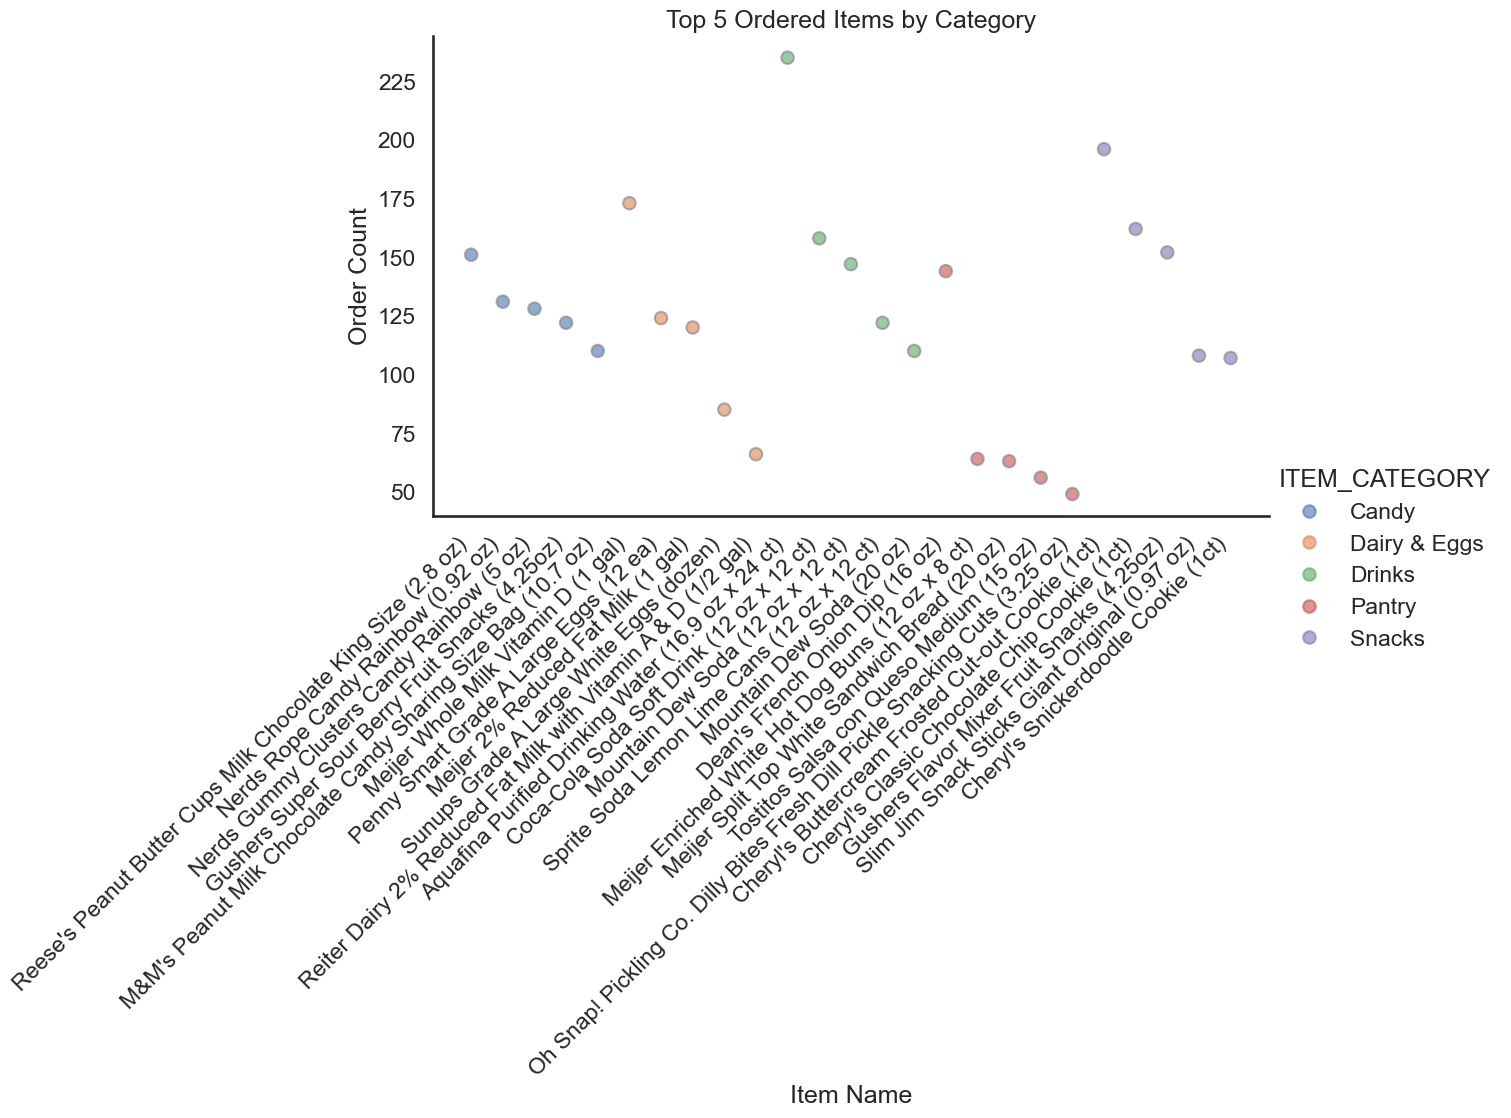
Menu Optimization:
- Share top 5 items per top 5 categories
- Help merchants stock popular items and improve substitutions
🧠 Strategic Recommendations
1. Fix the Small Order Problem
- Batching: Combine small orders
- Minimum Fare Guarantee
- Wait-Time Bonuses
2. Transform Grocery Partnerships
- Short-Term: Launch Partner Success Program
- Long-Term: Shift toward DashMart’s scalable model
3. Reinforce Peak Hour Operations
- Driver Supply Surge: Incentivize 19:00–00:00
- Push Notifications: “Evening Rush Bonus”